Analytics
The Analytics page displays the summary of all the data and engagements for all the user’s presentations, whether they are Listing Presentation or an Open House.
Analytics Dashboard
The Analytics dashboard shows the overall information about all the presentations of the user.
To open the analytics dashboard, the user must click the profile picture icon at the dashboard.

The user must then click the Analytics button in the dropdown menu.
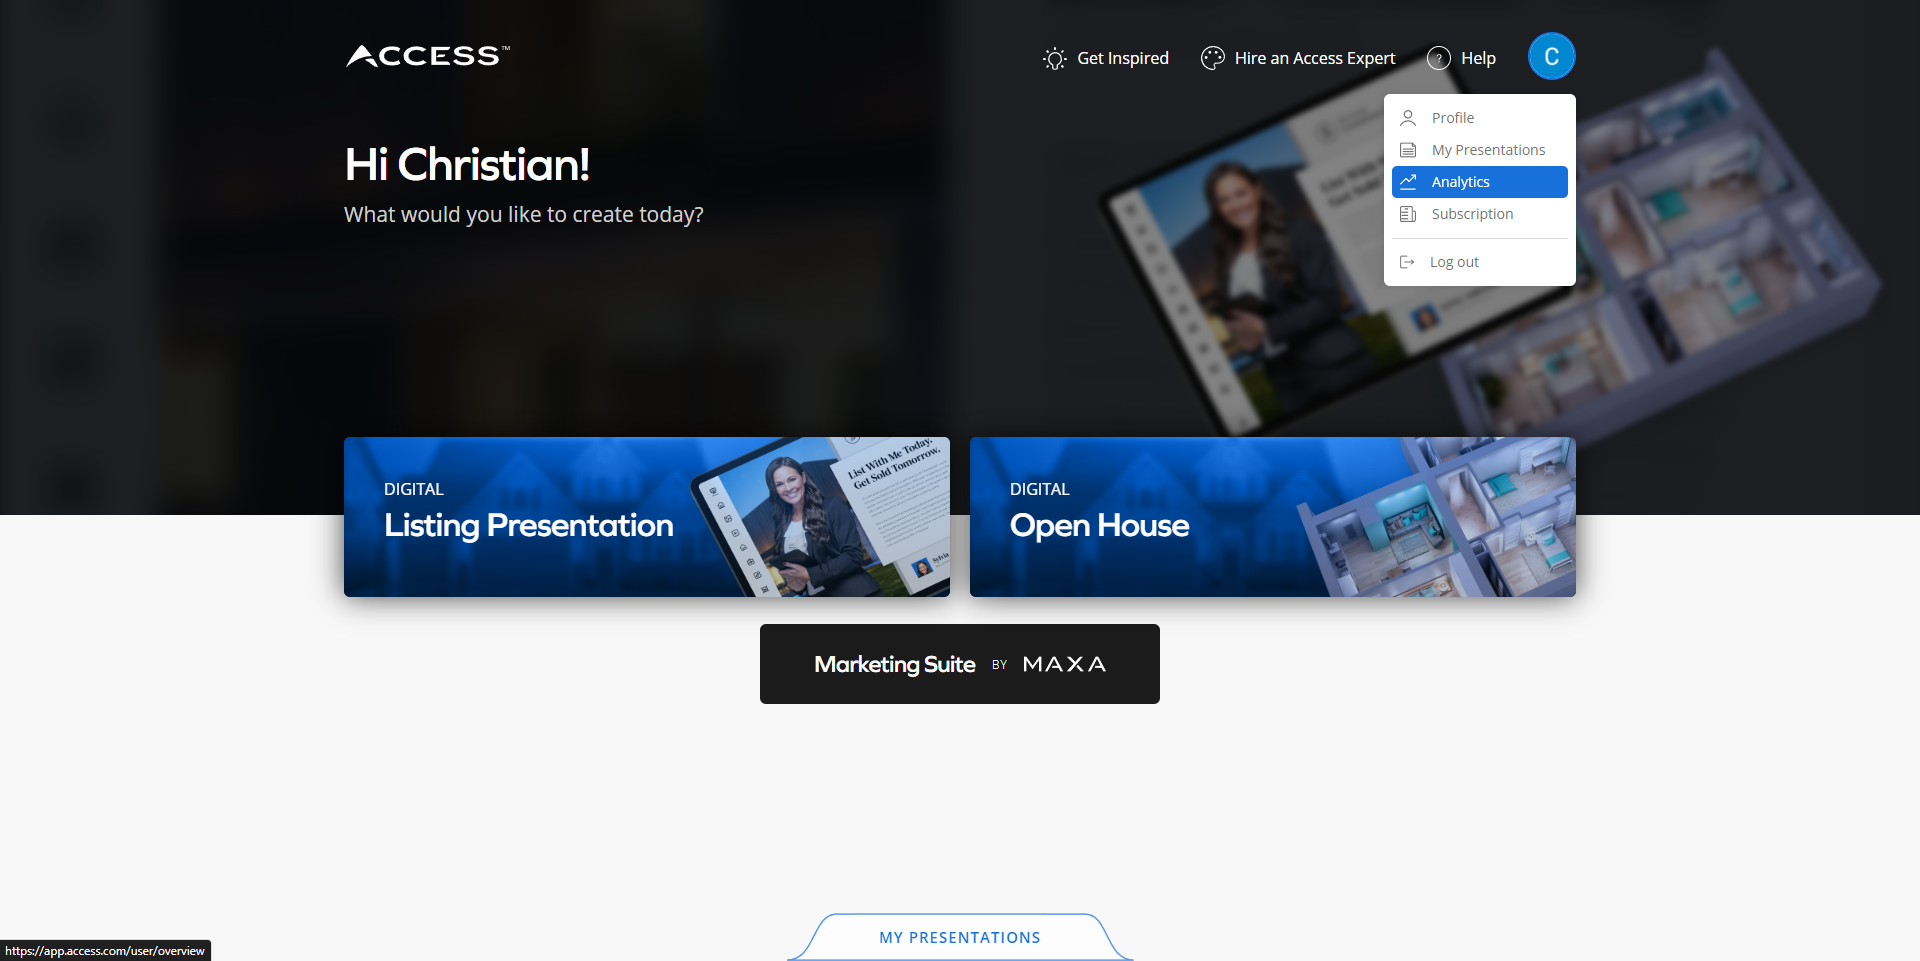
The user will then be redirected to the Analytics dashboard.

Data Widgets
Data widgets are available where information per presentation type is shown.
The data for each presentation type includes the following:
- Total number of presentations
- Number of published presentations
- Number of draft presentations
- Number of unpublished presentations

Presentation List
The presentation list shows all the presentations of the user and provides the following information:
- Name of Presentation
- Date Created
- Type (Listing Presentation or Open House Presentation)
- Status (Draft, Published, or Unpublished)
- Number of Views
- Number of Inquiries

Analytics Per Presentation
The analytics per presentation shows the specific engagement data available for that presentation.
The user can view this page by clicking on the presentation in the list.

The user can also open the analytics per presentation by clicking the My Presentations button at the dashboard.

The user must then click the three vertical dots at the chosen presentation.

A dropdown menu will appear where the user must click the Analytics button.

The user will then be redirected to the analytics page for that specific presentation.

Views
The user can view the number of audience who opened the presentation.

Total Average Time Spent
The user can view the total average time spent by the audience while viewing the presentation.

Average Time Spent Per Section
The user can view the average time spent by the audience while viewing a section of the presentation.

Demographics
The user can view the number of users per location including the following:
- Date when the user viewed the presentation
- IP Address of the user
- Section visited by the user
- Time spent by the user on the specific page

Date Filter
The user can select a specific month for a more specific and filtered data.

Export Data
The user can export all the analytical data for the presentation to a PDF file that will automatically be downloaded to their local machine.

